Computational Jazz Improvisation Research
This research is in progress
2019 ~ 2020
Since 2019, I have worked on analyzing Jazz improvisation data created by the Jazzomat
Research Project. Unlike European classical music, where the artistic intent of the composer is
fully represented on the score as a static form, Jazz improvisation is more of a instant call and
response among advanced performers. Therefore, when analyzing jazz improvisation data
computationally, it is crucial consider this musical characteristic.
During my graduate study at Stanford, I worked with Professor Jonathan Berger on this project,
and the initial task was to find the proper computational approach to analyze this dataset.
Jazzomat Research Project divides Jazz into 6 tonality types; Blues, Color, Free, Functional, Jazz-
Blues, and Modal. For this research, I’ve selected ‘Functional’ tonality, which is defined as “[Jazz
tunes] deeply rooted in Western tradition, mainly (light) classical music, with a preference for added chord colors
(tensions, upper structure)…Chord transitions follow mostly cadential patterns, e.g., II-V(-I) sequences or, more
generally, chord root movement in fifths (mostly downwards).”, because the premise of a ‘Functional’
tonality Jazz improvisation lies on the surface of the music compared to other tonalities, it was
more approachable to start with as a first research topic of computational analysis of Jazz.
After several attempts, I used Dr. Dmitri Tymoczko’s theory of tonal harmony for analyzing
‘functional’ tonality improvisations. Tymoczko’s theory was useful because it provided a complete
framework to analyze harmony in a micro level. Since the macro level harmony of Jazz is
straightforward and the micro level is volatile, Tymoczko’s theory worked extremely well. In
detail, I have done the following. In Tymoczko’s book ‘Geometry of Music’ he shows a tool
named scale finder which shows all possible scales from a collection of notes.
Using this, I’ve calculated the number of scales available from the improvisation data in a note by
note, cumulative fashion. For example, if the first three consecutive notes of the improvisation are
‘Bb’, ‘D’, and ‘E’, there are 33 scales available in the first note(‘Bb’), 19 scales available in the
second note(‘Bb’, ‘D’), and 9 scales available in the third note(‘Bb’, ‘D’, ’E’). This shows how the
ambiguity of the harmony decreases as the improvisation proceeds.
Now, let’s assume that the next two notes of the previous example are ‘Ab’ and ‘A’. When it
reaches ‘A’ (cumulated notes : ‘Bb’ , ‘D’, ‘E’, ‘Ab’, ‘A’), there are no other scales that matches this
combination. When there are no other scales available, I defined this incident as a ‘change’ (i.e it
is unrelated to how this term is used in Jazz), and refreshed the cumulation and restart it from A.
So in this case, when it reaches ‘A’, it counts the number of scales that contains only the note ‘A’
where there are 33 scales available.
I’ve done the exact same process with the chord progression. Since Jazzomat Research Project’s
database provides the type of chord played for each note during improvisation, I was able track
the number of scales of the chord progression in a note by note basis too. Then, I compared the
two of them and counted the number of scales that overlaps each other. Through this I was able
to observe the harmonic state of the improvisation in marginally. Based on this analysis, I’ve
create visualization so that it can be shown more intuitively.
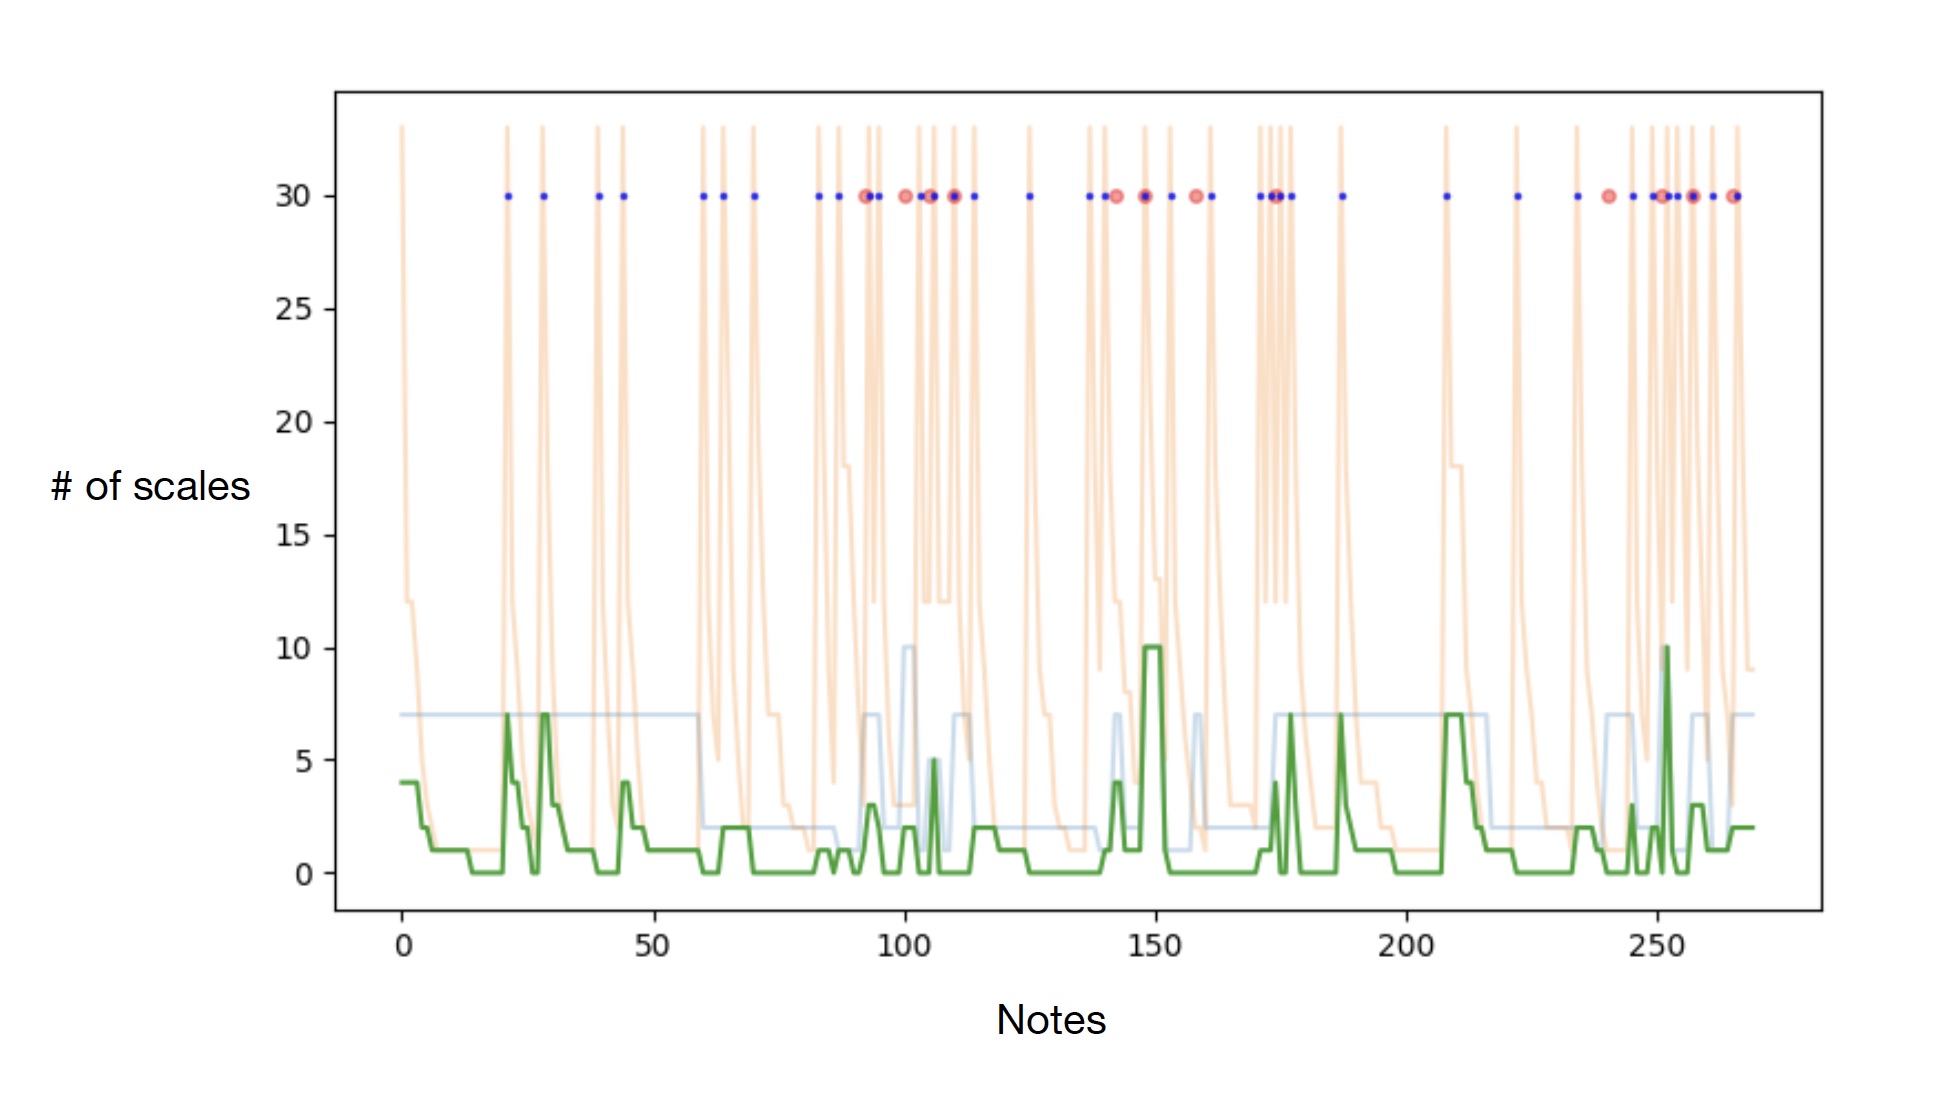
The image on the top is a visualization of an improvisation done by ‘Charlie Parker’. The orange line
shows the number of scales of the notes improvised, the blue line shows the number of scales of
the chords, and the green line shows the number of scales in common from both the chord and
the note. The blue dot shows when the ‘change’ happened in the notes, and the red dot shows
when the ‘change’ happened in the chord progression.